Q98
If families from the “Houseless” category shift into Kutcha houses, what will be the average number of families in every Kutcha house ?
- (a)
- (b)
- (c)
- (d)
Study the following Pie Charts :
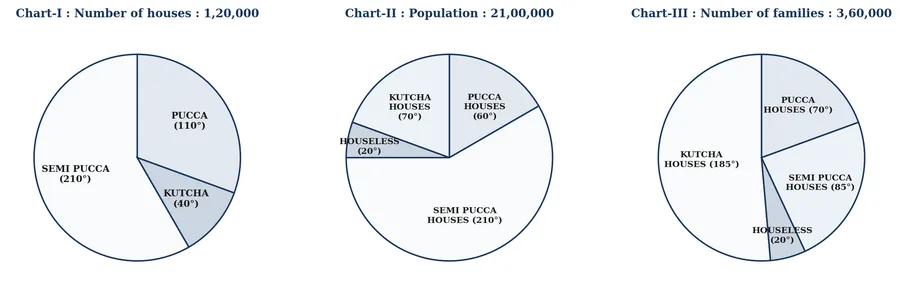
Chart-I : Number of houses : 1,20,000 PUCCA (), SEMI PUCCA (), KUTCHA ()
Chart-II : Population : 21,00,000 LIVING IN PUCCA HOUSES (), LIVING IN KUTCHA HOUSES (), HOUSELESS (), LIVING IN SEMI PUCCA HOUSES ()
Chart-III : Number of families : 3,60,000 LIVING IN PUCCA HOUSES (), LIVING IN KUTCHA HOUSES (), HOUSELESS (), LIVING IN SEMI PUCCA HOUSES ()
If families from the “Houseless” category shift into Kutcha houses, what will be the average number of families in every Kutcha house ?
Answer: (b)