By signing in you confirm you are 18 or older, or have your parent’s or guardian’s consent.

CDS 1 2025 Maths, question 96

Topic: Statistics

Passage · Q96 to Q98

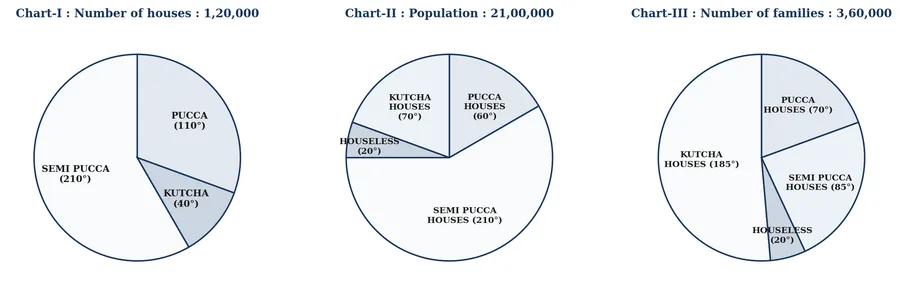
Study the following Pie Charts :

Three pie charts: houses, population and families by type of house

Chart-I : Number of houses : 1,20,000 PUCCA (110∘110^{\circ}), SEMI PUCCA (210∘210^{\circ}), KUTCHA (40∘40^{\circ})

Chart-II : Population : 21,00,000 LIVING IN PUCCA HOUSES (60∘60^{\circ}), LIVING IN KUTCHA HOUSES (70∘70^{\circ}), HOUSELESS (20∘20^{\circ}), LIVING IN SEMI PUCCA HOUSES (210∘210^{\circ})

Chart-III : Number of families : 3,60,000 LIVING IN PUCCA HOUSES (70∘70^{\circ}), LIVING IN KUTCHA HOUSES (185∘185^{\circ}), HOUSELESS (20∘20^{\circ}), LIVING IN SEMI PUCCA HOUSES (85∘85^{\circ})

Q96

On an average, how many persons live in every pucca house ?

  1. (a) 88
  2. (b) 8.548.54
  3. (c) 9.549.54Correct answer
  4. (d) 7.547.54

Solution.

Answer: (c) 9.549.54

  1. Pucca houses =110360×120000=1100003≈36667= \frac{110}{360} \times 120000 = \frac{110000}{3} \approx 36667.
  2. People living in pucca houses =60360×2100000=350000= \frac{60}{360} \times 2100000 = 350000.
  3. Persons per pucca house =350000÷1100003=10511≈9.545= 350000 \div \frac{110000}{3} = \frac{105}{11} \approx 9.545, which is the listed 9.549.54; no other option comes close.